
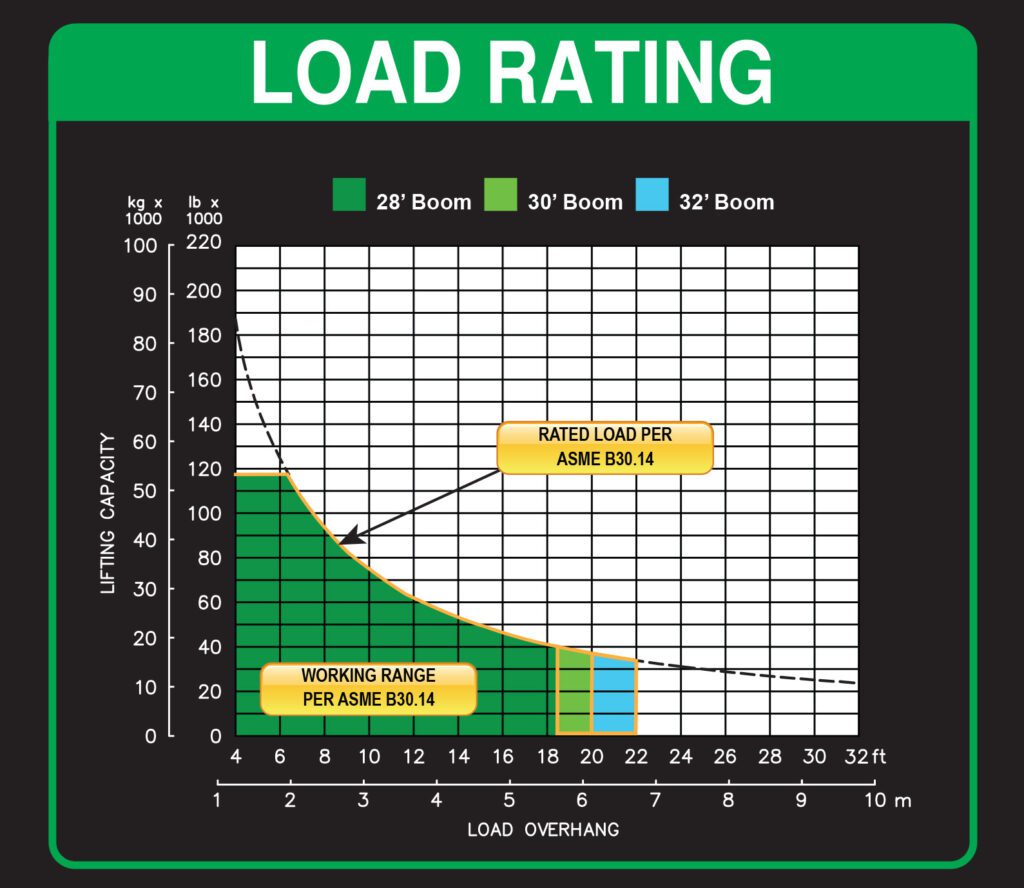
How to Read a Sideboom Load Chart: A Practical Guide
A sideboom’s rated capacity is not a single number. What a machine can safely lift changes with how far the load sits from the machine, how the boom is positioned, and the ground it is working on. The load chart is the document that ties all of that together. Learning to read one is the difference between working confidently within a machine’s limits and guessing at them. This guide explains what a sideboom load chart shows, how to read it, and why the same machine is rated for very different loads depending on the situation.
What Is a Sideboom Load Chart?
A load chart is the manufacturer’s published record of how much a specific machine can safely lift under defined conditions. For a sideboom, it maps lifting capacity against the key variable that changes it most: the load’s distance from the machine, often expressed as boom angle or overhang. The chart tells the operator the maximum load allowed at each position, so lifts are planned against published limits rather than feel.
Capacity falls as the load moves away from the machine. A sideboom holding a joint of pipe close in can handle far more than the same machine reaching out to place that pipe over the trench. The load chart quantifies that falloff, and reading it correctly is fundamental to safe operation.
Why a Sideboom’s Capacity Changes
Two forces are always in tension during a lift: the weight of the load trying to tip the machine over its tracks, and the machine’s own weight and counterweight resisting that tip. As a load moves farther from the machine, its leverage increases, and the machine’s stability margin shrinks. That is why capacity is never a single figure.
- Load radius or overhang. The horizontal distance from the machine to the load. Greater distance means a longer lever arm and lower rated capacity.
- Boom angle. How high or low the boom is set changes where the load sits relative to the machine and its tipping line.
- Counterweight. The counterweight offsets the load on the opposite side; its position and mass are built into the machine’s rated figures.
- Ground conditions. A load chart assumes a firm, level surface. Slopes and soft ground reduce real-world capacity below the chart, which is part of why purpose-built tracked machines matter, as we cover in why sideboom tractors are critical for pipeline installation.
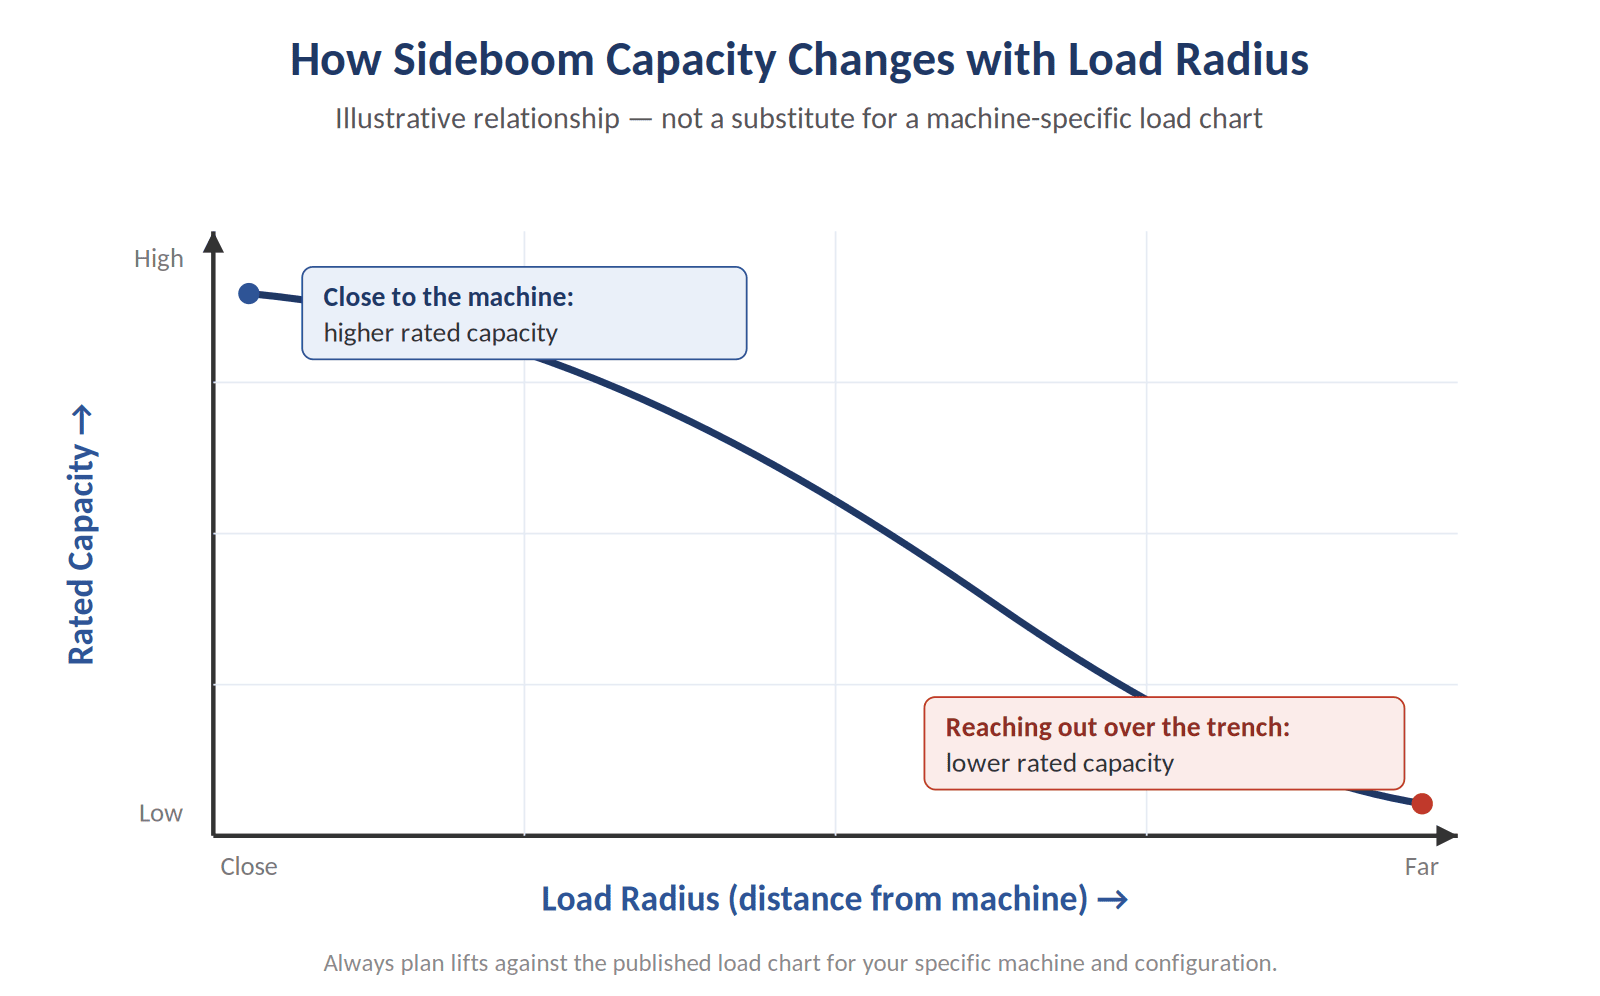
Rated capacity falls as the load moves farther from the machine. Actual figures come from your machine’s published load chart.
How to Read a Sideboom Load Chart
Charts vary by manufacturer and model, but the method for reading one follows a consistent logic:
- 1. Identify the load’s distance from the machine. Determine the radius or overhang at which the pipe will actually be handled, not just where the lift begins.
- 2. Find that distance on the chart. Locate the column or curve corresponding to that radius or boom position.
- 3. Read the rated capacity. The chart gives the maximum allowable load at that position. This is the ceiling, not a target.
- 4. Account for real conditions. Subtract the weight of rigging, blocks, and any below-the-hook devices from the rated figure, and derate further for slope or soft ground.
- 5. Confirm you are within limits. The actual load, including everything below the hook, must stay under the adjusted rated capacity through the entire lift path.
The most common mistake is reading capacity at the wrong point. A lift that starts close to the machine but ends with the pipe extended over the trench must be planned for the farthest, weakest point in that path, not the strongest.
Tipping Capacity vs. Rated Capacity
It is worth understanding the difference between the load that would actually tip a machine and its published rated capacity. Rated capacity is set at a percentage of tipping load, building in a safety margin so the machine is never worked to the point of instability. When a load chart lists a maximum, that figure already includes that margin. Treating the rated number as the hard ceiling, and staying below it, is what keeps the margin intact.
Formal lifting standards define how these ratings and operating practices are established. For sideboom tractors specifically, the governing standard in the United States is ASME B30.14, which covers the construction, operation, inspection, testing, and maintenance of side boom tractors used for pipe laying and lifting. Our overview of the ASME B30.14 sideboom standard breaks down what contractors and operators need to know, and the standard itself sits within the broader ASME B30 standard family governing cranes and related lifting equipment.
Operator Aids That Support Safe Lifting
Modern sidebooms increasingly pair the load chart with electronic aids that help the operator stay within it. Midwestern Manufacturing offers load monitoring and anti-two-block systems as operational aids, giving real-time feedback on the load and preventing the hook block from being drawn into the boom tip. These do not replace the load chart or operator judgment; they reinforce them, adding a layer of awareness during the lift.
Midwestern Sideboom and Pipelayer Attachments
Midwestern Manufacturing has built sideboom and pipelayer attachments for more than 70 years, with lifting capacities from 10,000 to over 200,000 lb across CAT, John Deere, and other platforms. Each machine is supplied with the rating information operators need to plan lifts safely, backed by available operator aids for added confidence in the field. To match a machine and capacity to your project, contact the Midwestern team.
Frequently Asked Questions
What is a sideboom load chart?
A sideboom load chart is the manufacturer’s published record of how much a specific machine can safely lift at different load positions. It maps rated capacity against the load’s distance from the machine, so operators can plan lifts against defined limits rather than estimates.
Why does a sideboom’s lifting capacity decrease with distance?
As a load moves farther from the machine, its leverage over the machine’s tipping line increases while the machine’s stability margin shrinks. The load chart reflects this by listing lower rated capacities at greater load radii or overhangs.
What is the difference between tipping capacity and rated capacity?
Tipping capacity is the load that would actually destabilize the machine. Rated capacity is set at a percentage of that tipping load, building in a safety margin. Load charts publish rated capacities, so the machine is never intended to be worked up to its tipping point.
What standard governs sideboom tractor lifting?
In the United States, ASME B30.14 is the safety standard for side boom tractors. It addresses construction, inspection, testing, maintenance, and operation, and is part of the broader ASME B30 family of standards for cranes and lifting equipment.
Does ground condition affect what a load chart allows?
Yes. Load charts assume a firm, level surface. Working on a slope or soft ground reduces a machine’s real-world capacity below the chart figure, so operators must derate accordingly and account for rigging weight below the hook.
Plan Every Lift With the Chart in Hand
A load chart turns a machine’s capacity from a guess into a plan. Reading it correctly, and respecting the margin built into it, is core to safe, efficient sideboom work. Midwestern Manufacturing’s sideboom and pipelayer attachments come with the rating information and available operator aids crews need to lift with confidence. Explore our pipelayer attachments or get in touch to find the right machine for your project.
Author: Joe B.
Comments are closed.